Many of the basic probability kernels associated with population dispersal
find their basis in partial differential equations. For example, the normal
distribution is associated withthe diffusion equation
Now, suppose a population of organisms is dispersed over space with an initial
density of ![]() . One can think of the number of individuals located in a
small interval of size
. One can think of the number of individuals located in a
small interval of size ![]() at a location
at a location ![]() as
as ![]() . These
indidviduals disperse randomly according to the distribution
. These
indidviduals disperse randomly according to the distribution ![]() ; thus,
their probabilistic location at a later time will be
; thus,
their probabilistic location at a later time will be
The Fourier Transform of a function defined on an interval from ![]() to
to ![]() is
is
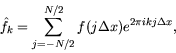
The numerical (or Discrete) Fourier Transform (DFT) is defined with summations
instead of integrals,
We can use FFTs
in MATLAB to calculate convolutions rapidly. Let's begin by illustrating the
procedure for a population initially localized uniformly between -1 and 1,
dispersing over time into a much larger domain. The FFT assumes periodicity,
so if we define a space interval between -10 and 10 with 256 nodes (remember
the FFT is much more efficient for computations involving ![]() elements), we
need to take into account that the node corresponding to 10 must be left off
(the FFT assumes that whatever data might be specified there is identical with
the data at
elements), we
need to take into account that the node corresponding to 10 must be left off
(the FFT assumes that whatever data might be specified there is identical with
the data at ![]() ). So, to define this space:
). So, to define this space:
     xlr=10; np=256; dx=2*xlr/np;
     x=dx*[0:np-1]-xlr;        % OR, equivalently
     x=linspace(-xlr,xlr-dx,np);
The independent variable is now defined. Let's also define the normal dispersal kernel and the initial population:
     p0 = (abs(x) <= 1);
     t=1; D=1;
     K=1/sqrt(4*pi*D*t)*exp(-x.^2/(4*D*t));
Having the relevant functions defined we can now take the Fourier transform
     fp0=fft(p0);
     fK=fft(K);
Using the fact that the transform of the convolution is the product of the
transforms, we can now evaluate the convolution:
     fp1=fK.*fp0;
     p1=dx*fftshift( ifft( fp1 ) );
The vector p1 now contains the dispersed population after 1 time unit, but there are some weird things in the command that need explaining. First off, the command fftshift basically chops a vector in half and interchanges the first and second halves as blocks. In this context it is necessary because the MATLAB FFT is built on the assumption that functions are defined on the interval from 0 to 1, as opposed to centered around 0. Secondly, the factor of dx. Firstly, for numerical efficiency the FFT multiplies a vector by np, and the inverse FFT divides by that factor. Since we have implemented a product of FFTs, we need to divide out a factor of np. Secondly, numerical FFTs assume that functions are defined on an interval of length 1, but our function is defined on an interval of length 2*xlr, and so the FFT must be scaled by the interval length. Together, these two conditions are equivalent to multiplying by the step size, dx=2*xlr/np, which is convenient from our perspective.
Now let's see what we have done:
plot(x,p0,'r',x,p1,'y')
You should also get a warning about imaginary numbers being ignored. This
occurs because the FFT requires complex numbers, and numerical rounding
creates very small imaginary components, even for perfectly real data fields.
The best way to get around this is to take the real part after
convolution, which we will do in the future. Now it is possible to keep
iterating the random dispersal of the population. We can get the population
after the next time step using a single long, cryptic MATLAB command:
p2=dx*real( fftshift( ifft( fft( p1 ).*fK ) ) );
Use hold on to plot this against the previous results. Does it look
reasonable? Use the up-arrow (
EXERCISE 6: Use MATLAB to define the population density function
Another interesting dispersal model involves assuming random motion for
propagules (seeds, spores, pollen, motile larvae) while they are in the medium and then
settling onto a substrate at some rate ![]() . If propagules are initially
released at the point
. If propagules are initially
released at the point ![]() the PDE modelling the density of propagules in the
medium is
the PDE modelling the density of propagules in the
medium is
     D=1; a=2;
     KS=sqrt(.25*a/D)*exp(-sqrt(a/D)*abs(x));
     plot(x,KS,'r')
Now try plotting KS on the same axes, varying the settling rate,
EXERCISE 7: For a uniform distribution of sources between -1 and 1 investigate the
dispersal of propagules according to the probability distribution ![]() given
above. On the same set of axes plot the effect of changing
given
above. On the same set of axes plot the effect of changing ![]() on the
dispersal of the population.
on the
dispersal of the population.
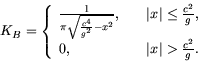
A model for ballistic dispersal of spores from ground level in random
directions is given by Neubert, Kot and Lewis, 1995, by
We could illustrate the spread of the colony using the commands we have already mastered in MATLAB , but this is a good place to use an `m' file, which is a MATLAB script which runs a sequence of commands. In the File menu of the MATLAB command window click on New and then M-file. An editor/debugger window will pop up, in which you can type in a series of commands, save it as an M-file, and then execute the whole sequence by referring to the M-file. Below appears the text for an M-file modelling this dispersal.
%
%     BALLSPORE
%
%     a Matlab M-file which models ballistic dispersal of fungi in 1-D
%

pold = pnew;          % define initial condition, this step --
                      %     USER MUST DEFINE THE FIRST pnew
                      %     BEFORE RUNNING THIS PROGRAM

KB=1./(pi*sqrt(c^4/g^2-x.^2)).*(abs(x) <= c^2/g);
                  % define dispersal kernel, taking care that it is zero in
                  %   the right places

KB=KB/trapz(dx*KB);
                  % this normalizes the probability kernel.  Because of
                  %   the singularities at the ends this is an important
                  %   step -- otherwise there will be net loss

fKB=dx*fft(KB);   % Take FFT of dispersal kernel, multiplying by dx to save
                  %   that step later

fpnew = fKB.*fft(pold);
                  % FFT of new dispersed population
pnew = real(fftshift(ifft(fpnew)));
                  % new dispersed population

hold on, plot(x,pnew,'r'), hold off
                  % plot results on current figure
When you have this all typed in to the editor, save the file as ballspore.m and click on the command window to activate it. Make sure
that the directory you are in in the command window is the same as the
directory you save the program ballspore.m in! Now we must set the
initial space up, the parameters, and the initial
colony:
     g=980;                     % cm/s^2 for gravity constant
     c=50;                      % cm/s speed of ejection
     xlr=15; np=256; dx=2*xlr/np;
     x=-xlr+dx*[0:np-1];        % define independent variable
     pnew=(abs(x) <= 1);
Now we can plot the initial population and call ballspore, which will plot
subsequent dispersed populations on the same graph. So, in the command window type:
     plot(x,pnew,'y')
     ballspore
Now, you can see the evolution of the dispersing population by using
If propagules (density ![]() ) move at constant speed to the left and right away
from a source and settle at some rate
) move at constant speed to the left and right away
from a source and settle at some rate ![]() , the precipitated individuals
(density
, the precipitated individuals
(density ![]() ) satisfy the following system of PDE (from Neubert et. al.,
1995):
) satisfy the following system of PDE (from Neubert et. al.,
1995):
EXERCISE 8: Under the assumption that every settled propagule becomes a
propagule-producing adult, write an M-file in MATLAB that will allow you to
investigate the multi-generational dispersal of an initially-localized
population with dispersal probability given by ![]() . How would you modify
this code to reflect mortality or non-germination - say only 50% of
dispersed individuals survive to become adults? Could you modify it to have
more than one generation producing propagules?
. How would you modify
this code to reflect mortality or non-germination - say only 50% of
dispersed individuals survive to become adults? Could you modify it to have
more than one generation producing propagules?
Now we have more than enough understanding to move on to two-dimensional dispersal. Mainly there is nothing more complicated than in one dimension, except that it can be computationally much more time consuming and more difficult to visualize. But the computational techniques are identical in MATLAB , except that a few commands (mainly the FFT commands) need to be changed to 2-D versions.
As in the case of one dimensional random dispersal, dispersal generated by random walks in two dimensions is modelled by the diffusion equation,
     xlr=10; ylr=10; np=128; dx=2*xlr/np; dy=2*ylr/np;
     x=linspace(-xlr,xlr-dx,np);
     y=linspace(-ylr,ylr-dy,np);
     [X,Y]=meshgrid(x,y);
     t=1; D=1;
     K2D=1/(4*pi*D*t)*exp(-(X.^2+Y.^2)./(4*D*t));
You may wish to take a second and visualize this using surf or pcolor and shading flat or shading interp. Now, to see how a
population initially
localized in the rectangle
     p0=(abs(X)<=3 & abs(Y)<= 1);
     fp0=fft2(p0);
     fK2D=dx*dy*fft2(K2D);
     fp1=fp0.*fK2D;
     p1=real( fftshift( ifft2( fp1 ) ) );
Some things to observe: the overall format for implementing dispersal is the
same as in one dimension, with the exceptions that fft and ifft
are replaced by fft2 and ifft2; there is now a multiplication by
both dx and dy to implement the convolution.
To visualize how the initial field relates to the dispersed field we will use
a combination of graphics - one choice would be contours for the initial
field and density plots for the dispersed field, as in:
pcolor(X,Y,p1),shading flat, hold on, contour(X,Y,p0,'m'), hold off
You may want to further use the options axis square and colormap
hot. The hot colormap, in particular, is useful in interpreting density
plots, since it gives a clear indication of high and low values. To see which
colors correspond to which values, you may also use the command colorbar, which will add a color scale with associated scalar values. You
might also want to try a combination surface/contour plot, as in
surf(X,Y,p1+1),shading flat, hold on, contour(X,Y,p0,'m'), hold off
For most applications I find it easiest to use combinations of density and contour plots.
EXERCISE 9: Disperse this population for one more time step, saving p1 and creating a new, twice-dispersed population, p2. Plot all three populations on a single graph using contours in two different colors for p0 and p1 and a hot-colored density plot for p2. Use the combination of commands dx*dy*trapz(trapz(p2)) to estimate the double integral of p2, and then compare that to the previous two dispersal slices to make sure that the population is being conserved.
Well, there were many, many different things to do in one dimension, and as
you might guess there are infinitely many more in two dimensions. We will discover
more of these as we go along, but as a parting shot let's model a combination
of advection and diffusion in two dimensions. Suppose a population is
performing random walks in a medium which moves in a particular direction with
velocities ![]() and
and ![]() in the
in the ![]() and
and ![]() directions, respectively.
Without belaboring the details,
it can be shown that an individual initially localized at the origin disperses
with probability
directions, respectively.
Without belaboring the details,
it can be shown that an individual initially localized at the origin disperses
with probability
EXERCISE 10: Investigate the advective/diffusive dispersal of a population which is
initially localized, according to the probability kernel ![]() . Pick
. Pick
![]() ,
, ![]() , and use the command
, and use the command
p0=(abs(X+8)<=.5 & abs(Y+8)<=.5);
to specify the initial population. Define the dispersal kernel
EXERCISE 11: Build an M-file which will allow you to investigate the behavior of a population in an advection/diffusion setting with random winds. That is, over each period of dispersal (`day') the wind speed is constant, but from day to day the direction will vary randomly. Hint: In MATLAB the command for generating uniformly distributed random numbers is rand. Visualize a couple of dispersal steps for a population localized initially uniformly in a disk of radius 1 centered at (0,0). Would it be hard to modify your program to account for random changes in wind speed as well?
Another characteristic of moving, living things is that they move for a
reason, generally to get somewhere or avoid something. An example would be
predators or parasites searching for prey/hosts. Even the simplest of beings
is likely to slow down, that is, to take shorter steps in its random searching
motions, when it is in the presence of prey items. Let ![]() be the
density of `victims' in space, and let
be the
density of `victims' in space, and let ![]() be the density of searchers
(predators/parasites). Let
be the density of searchers
(predators/parasites). Let ![]() be the diffusivity of
be the diffusivity of ![]() in the absence of
victims and
in the absence of
victims and ![]() the diffusivity in the presence of victims. Varying
motility of the searcher can be modelled (following Turchin, Reeve,
Cronin and Wilkens, 1997) by
the diffusivity in the presence of victims. Varying
motility of the searcher can be modelled (following Turchin, Reeve,
Cronin and Wilkens, 1997) by
This solution becomes increasingly valid as ![]() tends to zero
(or as the diffusivities become more alike), and depends critically on
tends to zero
(or as the diffusivities become more alike), and depends critically on ![]() being `large'. The solution is not valid at all for very large or highly
variable densities of prey, or when
being `large'. The solution is not valid at all for very large or highly
variable densities of prey, or when ![]() is small, or when
is small, or when ![]() is taken to be
large. Fortunately, solving PDE is
not our best and highest goal. As a model for victim-taxis, the
approximation above can
serve perfectly well! We must separate the elements which give the random
character of diffusivity from the elements defining the spatial structure of
changing motility in the presence of prey. The approach will be to:
is taken to be
large. Fortunately, solving PDE is
not our best and highest goal. As a model for victim-taxis, the
approximation above can
serve perfectly well! We must separate the elements which give the random
character of diffusivity from the elements defining the spatial structure of
changing motility in the presence of prey. The approach will be to:
     %
     %    Testing out Turchin-taxis
     %
     %    Set up space:
     %
     np=128;
     xl=10; dx=2*xl/np;
     x=linspace(-xl,xl-dx,np);
     [X,Y]=meshgrid(x,x);

     %   Define parameters

     D2=2; D1=1.5;                     % the motilities
     d=1; t=4;                         % saturation parameter, time
     V=exp(-(X-5).^2./4-(Y-5).^2);     % these are the victims:

     %   perturbation to the basic motility (D2):
     muhat=4*del2((D2-D1)*(D2*V)./(d*D1+ D2*V) ,dx,dx);

     %   Set initial population of predators

     P=((X.^2+Y.^2)<=4);
     numP=dx^2*trapz(trapz(P));        % total number predators

     %   Define dispersal kernel

     K=.25/(pi*D2*t)*exp(-(X.^2+Y.^2)/(4*D2*t));
     fK=dx.^2*fft2(K);

     %   Disperse population according to turchin-taxis

     fP=fft2(P);
     Pt=exp(-muhat*t).*real(fftshift(ifft2(fP.*fK)));

     %   Normalize the dispersed population

     numPt=dx^2*trapz(trapz(Pt));
     Pt=numP/numPt*Pt;

     %   Plot the results in comparison with the victims

     pcolor(X,Y,Pt), shading interp, colormap hot, axis square
     hold on, contour(X,Y,V,'b'),  hold off
One difficulty with this sort of approach is that it is not `linear' in
EXERCISE 12: With the above MATLAB code for
defining a prey-tactic dispersal kernel, determine how a population of
predators, initially localized near ![]() , redistributes in response to the
population of victims given above. In two different figures plot the density
response of the predators as a density field after 4 and 8 time units of
dispersal. Indicate the starting point, and plot contours of the victim field
to see how the taxis orients the population. Check to see that the number of
searching individuals is being preserved. Can you explain these results in
terms of decreased motility in the presence of they prey?
, redistributes in response to the
population of victims given above. In two different figures plot the density
response of the predators as a density field after 4 and 8 time units of
dispersal. Indicate the starting point, and plot contours of the victim field
to see how the taxis orients the population. Check to see that the number of
searching individuals is being preserved. Can you explain these results in
terms of decreased motility in the presence of they prey?
Congratulations! You have learned more about probabilistic dispersal and convolutions in MATLAB than most people are learn in a life time!